Databricks vs Looker: BI Architecture Guide
Table of Contents
- Introduction: Databricks vs Looker
- Databricks vs Looker at a Glance
- Architecture: Where Lakehouse BI Runs
- Databricks AI/BI vs Looker BI for Self-Service Analytics
- Data Governance: Unity Catalog vs LookML
- Lakehouse BI Performance and Total Cost
- A Six-Step Databricks vs Looker Pilot
- Four Real-World Lakehouse BI Scenarios
- Databricks vs Looker Decision Checklist and Common Pitfalls
- Conclusion: Choosing the Right Databricks vs Looker Analytics Foundation
- Introduction: Databricks vs Looker
- Databricks vs Looker at a Glance
- Architecture: Where Lakehouse BI Runs
- Databricks AI/BI vs Looker BI for Self-Service Analytics
- Data Governance: Unity Catalog vs LookML
- Lakehouse BI Performance and Total Cost
- A Six-Step Databricks vs Looker Pilot
- Four Real-World Lakehouse BI Scenarios
- Databricks vs Looker Decision Checklist and Common Pitfalls
- Conclusion: Choosing the Right Databricks vs Looker Analytics Foundation
Introduction: Databricks vs Looker
A Databricks vs Looker decision may look like a dashboard comparison, but it is an architecture decision. Databricks AI/BI brings dashboards, natural-language analysis, SQL, and governance to the Databricks lakehouse; Looker connects databases to a governed LookML modeling layer.
This affects metric definitions, security, maintenance, and cross-platform data. This comparison covers:
- How each platform reaches and processes data
- Where business definitions and access rules live
- How to test cost, performance, and AI answers
- When a combined architecture makes more sense
TL;DR: There is no universal winner. Choose Databricks AI/BI for a Databricks-centered lakehouse, Looker BI for a dedicated semantic and delivery layer, or a hybrid when needed. Prefer the simplest system that answers business questions without weakening data control.
Databricks vs Looker at a Glance
Databricks AI/BI runs within the Databricks platform: Databricks SQL warehouses query dashboard data, while Unity Catalog governs access. Databricks describes its SQL warehouse as running directly on lakehouse data without requiring a separate copy for BI workloads (Databricks SQL documentation). This naturally fits lakehouse BI when ingestion, transformation, machine learning, and reporting already run in Databricks.
Looker is a BI and data application platform that connects to an existing database, translates user selections into SQL, and sends the query there. LookML defines measures, dimensions, joins, labels, and access behavior between the database and user.
| Area | Databricks AI/BI | Looker |
|---|---|---|
| Primary role | Analytics inside the Databricks platform | Governed BI across supported databases |
| Main modeling option | Unity Catalog metric views, SQL, and dashboard datasets | LookML models and Explores |
| Query engine | Databricks SQL warehouse | The connected database or warehouse |
| Natural-language tool | Genie Agents | Conversational Analytics powered by Gemini |
| Best initial fit | Data already lives in a Databricks lakehouse | Teams need a reusable BI layer across business domains |
| Can they work together? | Yes | Yes, Looker supports Databricks as a database connection |
Databricks and Looker can coexist.
Architecture: Where Lakehouse BI Runs
Follow one question: what happens when a marketing manager asks for revenue by campaign?
The usual Databricks AI/BI path is:
- Campaign, transaction, and customer data lands in cloud object storage.
- Databricks transforms it into governed tables or views.
- Unity Catalog records permissions and business metadata.
- A Databricks SQL warehouse runs the dashboard or Genie query.
This direct lakehouse BI design has fewer platform boundaries and lets analysts move between dashboards, SQL, and notebooks without changing the underlying data system.
The Looker path is:
- Data is prepared in Databricks, BigQuery, Snowflake, Redshift, or another supported database.
- A Looker connection reaches that system.
- LookML defines the joins and business meaning of fields.
- Looker generates SQL for an Explore, dashboard, application, or conversation.
Looker supports numerous SQL dialects, including Databricks, BigQuery, Snowflake, Redshift, PostgreSQL, and Trino, although capabilities vary by dialect (Looker dialect documentation).
| Architecture question | Prefer Databricks AI/BI when… | Prefer Looker when… |
|---|---|---|
| Where is most data? | It is already governed in Databricks | It spans warehouses or may move between them |
| Who builds models? | SQL and data engineering teams work in Databricks | A BI team maintains a dedicated semantic model |
| What should remain portable? | Lakehouse tables and metrics | Business-facing BI definitions and embedded experiences |
Databricks AI/BI vs Looker BI for Self-Service Analytics
Both platforms support natural-language questions but ground them differently, a distinction more important than demo quality.
Databricks Genie uses selected data, instructions, example questions, descriptions, and tested answers to produce queries and visual results through Databricks SQL.
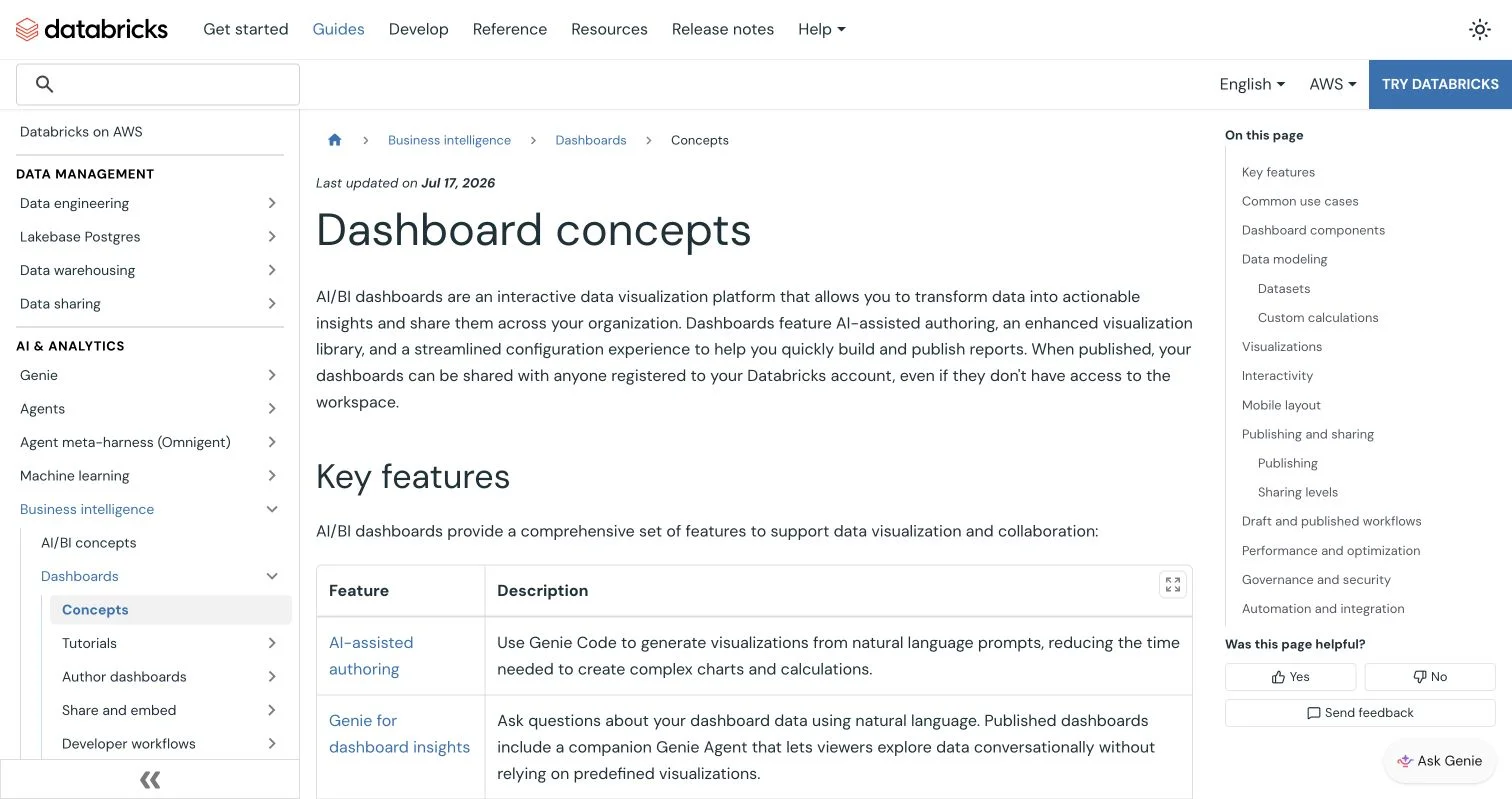
Databricks AI/BI dashboards also support AI-assisted authoring, convenient when data and BI maintainers share Databricks.
Databricks documents AI-assisted authoring, governed data models, filtering, sharing, and monitoring for AI/BI dashboards.
Through Looker’s semantic model, Gemini selects LookML fields, filters, sorts, and limits before Looker constructs the query.
LookML already defines the join logic. A data agent can use as many as five Explores, and conversational queries return no more than 5,000 rows according to the current product documentation (Looker Conversational Analytics overview).
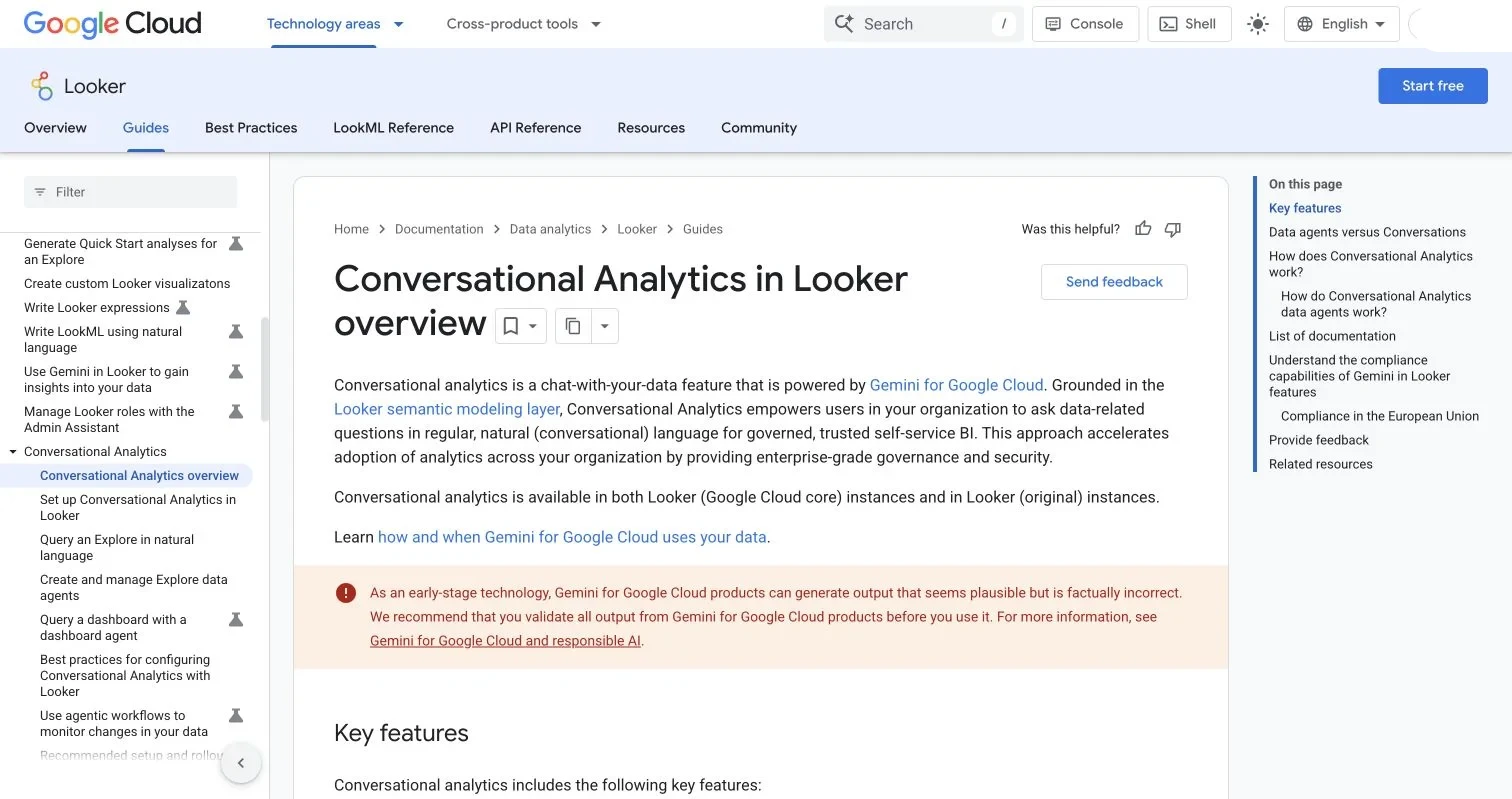
Looker grounds conversational analytics in its semantic model and presents it as a governed, self-service BI workflow.
| User request | Databricks approach | Looker approach |
|---|---|---|
| Show revenue by campaign | Query a selected table or metric view | Select governed LookML fields and filters |
| Explain an unusual result | Inspect generated SQL and lakehouse data | Inspect selected fields, filters, and calculations |
| Add business context | Configure Genie instructions and examples | Add LookML descriptions and agent instructions |
| Control the answer | Test benchmark questions | Test golden queries and LookML logic |
Neither tool fixes data quality. Google warns that conversational output can be plausible but incorrect, so test AI answers as an analytical interface rather than treating them as truth.
Data Governance: Unity Catalog vs LookML
Governance complicates the choice because each product controls a different layer.
Unity Catalog governs Databricks tables, views, files, models, and metric views. Row filters and column masks can protect sensitive records at the data layer (Unity Catalog filter and mask guide). Such policies can apply through dashboards, SQL, and other compatible Databricks interfaces.
Looker controls access through roles, model permissions, folders, grants, user attributes, and row-level access_filters. However, Google warns that the filter must be added to every Explore that needs the restriction; omitting it can expose unrestricted results through that Explore (Looker access filter documentation). Database permissions remain the lower security boundary.
Databricks metric views define reusable measures and dimensions as Unity Catalog objects (Databricks metric view documentation). Looker stores LookML projects in Git, allowing developers to review, test, branch, and deploy model changes (Looker version-control guide).
| Governance item | What to check | Why it matters |
|---|---|---|
| Metric ownership | Assign revenue, churn, and conversion owners | Correct-looking dashboards can disagree |
| Row restrictions | Test at the database and BI layers | A dashboard filter is not a security policy |
| Sensitive columns | Mask email, salary, and identifiers near the data | Protection should survive a new reporting tool |
| Change control | Review and validate before deployment | A renamed field can break many reports |
| Audit evidence | Record query, access, and policy changes | Security teams need evidence, not verbal assurance |
Lakehouse BI Performance and Total Cost
Performance depends on table design, concurrency, query complexity, caching, and compute.
Databricks AI/BI can reduce network and integration overhead for lakehouse data. Datasets below 100 MB and 100,000 rows can be browser-cached for faster interactions. A dashboard can contain up to 15 pages, 100 datasets, and 100 widgets per page (Databricks dashboard concepts, dashboard limits). These are limits, not targets: 100 widgets would make a page hard to use and costly to refresh.
Looker usually executes queries in the connected warehouse. Datagroups control its query cache, while persistent derived tables precompute selected transformations. A datagroup may invalidate cached results after a set age or when a SQL trigger detects a new load (Looker datagroup documentation).
| Cost category | Databricks AI/BI | Looker |
|---|---|---|
| Platform cost | Databricks consumption and cloud resources | Looker contract or edition cost |
| Query cost | SQL warehouse runtime | Connected warehouse runtime |
| Modeling work | SQL, metric views, and Unity Catalog administration | LookML development and BI administration |
| Hidden risk | Warehouses left running or inefficient scans | Duplicate models, PDT builds, and warehouse queries |
Compare monthly cost per active viewer and successful business query; license price alone distorts the result.
A Six-Step Databricks vs Looker Pilot
Use one business problem, real security rules, and representative data, not a general demo with a clean sample.
-
Choose one decision. Use a decision such as which campaigns should receive next month’s budget, then record the current answer time and approver.
-
Define the metrics first. First define formulas for five to ten measures, including spend, attributed revenue, customer acquisition cost, and conversion.
-
Build the same thin dataset. Give both products equivalent campaign, order, and customer data, documenting every change for a fair comparison.
-
Apply realistic access rules. Create marketing viewer, regional manager, and finance reviewer roles, then verify intended restrictions across direct queries, downloads, schedules, and embedded views.
-
Test human and AI workflows. Test 20 representative questions, including vague requests and questions with no valid answer. Score numerical correctness, query time, explanation quality, and manual corrections.
-
Run the pilot for 30 days. Measure median and 95th-percentile load time, compute cost, failed queries, weekly active users, and model-maintenance hours; interview users about blockers.
| Pilot result | Suggested threshold |
|---|---|
| Approved metric answers | At least 95% correct |
| Unauthorized test results | Zero |
| Common dashboard load time | Agreed before testing, then measured consistently |
| Model change traceability | Every production change has an owner and review record |
Set speed thresholds by business process; board dashboards and exploratory product analyses need not respond equally fast.
Four Real-World Lakehouse BI Scenarios
Architecture changes the answer in these four scenarios.
| Scenario | Better starting point | Reason |
|---|---|---|
| Marketing team with raw clickstream data in Delta tables | Databricks AI/BI | Combine large event, campaign, and customer data without a second BI pipeline |
| International retailer using BigQuery for sales and Snowflake for supply data | Looker | LookML presents shared definitions while data stays in existing systems |
| Software company embedding usage analytics for customers | Looker or a hybrid design | Looker embeds analytics while Databricks prepares and governs high-volume product events |
| Fraud team combining transactions, streaming features, and machine-learning output | Databricks AI/BI | Keep investigations near notebooks, models, governed tables, and SQL compute |
In the first example, an analyst may join billions of event rows to a small campaign table. Databricks keeps the lakehouse BI query, feature engineering, and data-quality investigation in one environment. Executives may still prefer Looker for certified metrics and embedded reporting, creating a reasonable hybrid: Databricks handles ingestion, transformation, machine learning, and lower-level governance, while Looker connects to its SQL warehouse and presents selected metrics through LookML.
A hybrid adds administration, a semantic layer, and a vendor boundary. Use it only for a specific problem that Looker’s delivery or modeling capabilities justify.
Databricks vs Looker Decision Checklist and Common Pitfalls
Start with governed data’s location, then how people consume it; compare features later.
| Question | Databricks AI/BI signal | Looker signal |
|---|---|---|
| Is Databricks already the main analytical platform? | Strong | Neutral; it can connect to Databricks |
| Must policies apply outside the BI interface? | Strong through Unity Catalog | Use database controls beneath Looker |
| Does the company need a dedicated, Git-managed BI model? | Possible with metric views and code workflows | Strong through LookML projects |
| Are embedded analytics central to the product? | Evaluate the required embedding model | Strong candidate |
| Are data sources likely to remain varied? | May require consolidation or external connections | Strong candidate across supported dialects |
| Do business users work beside data engineers? | Strong | Depends on BI team structure |
- Comparing charts instead of architecture. Both make standard dashboards; durable differences are data location, metric ownership, and security boundaries.
- Defining access only in the presentation layer. Because filters can be removed or forgotten, protect sensitive data near the database or catalog.
- Letting every team redefine revenue. Ungoverned self-service accelerates disagreement.
- Trusting AI after a polished demonstration. Test misspellings, vague periods, missing fields, unusual joins, and questions that should be rejected.
- Ignoring coexistence. Because Looker queries Databricks, replacement may be unnecessary.
A good decision reduces duplicate pipelines and unclear ownership. If a design adds copies, metric definitions, or security layers, require a business reason for each.
Conclusion: Choosing the Right Databricks vs Looker Analytics Foundation
Choose based on where analytics logic should live. Databricks AI/BI fits when data, engineering, governance, SQL, and AI workloads share Databricks; Looker fits a dedicated semantic and delivery layer across supported platforms, especially for governed self-service or embedded analytics.
Both require clean data, metric owners, security testing, and cost measurement. In a hybrid, Databricks manages the lakehouse while Looker presents selected data through LookML.
Next, run the six-step pilot on one costly reporting decision with real users, permissions, and 30 days of workload evidence. This test provides more insight than a long feature spreadsheet and a defensible comparison.
Frequently asked questions
Should we choose Databricks AI/BI if our data already lives in Databricks?
Usually, it is the strongest starting point because dashboards, SQL, governance, and AI analysis can operate within the same lakehouse environment. Confirm the choice with a pilot that measures performance, cost, security, and usability for real business workflows.
When is Looker a better fit than Databricks AI/BI?
Looker is often preferable when the organization needs a dedicated, Git-managed semantic layer, governed self-service across business domains, or embedded analytics. It is also useful when data remains across multiple supported databases rather than being consolidated in Databricks.
Can Looker and Databricks be used together?
Yes. Databricks can handle ingestion, transformation, machine learning, and data-level governance, while Looker connects to a Databricks SQL warehouse and delivers governed metrics through LookML. Use this hybrid only when its modeling or delivery benefits justify the additional administration and platform boundary.
Where should security rules be enforced?
Protect sensitive data as close to the database or catalog as possible so restrictions survive changes in dashboards and reporting tools. BI-layer controls remain useful, but they should complement, not replace, row restrictions, column masking, and database permissions.
Can we trust answers produced by Genie or Looker Conversational Analytics?
Natural-language results should be treated as analytical outputs that require validation, not as guaranteed facts. Test representative, vague, invalid, and security-sensitive questions against approved answers, and review the generated query logic when results appear unusual.
How should we compare the total cost of Databricks AI/BI and Looker?
Include platform or licensing costs, warehouse compute, modeling effort, administration, caching, and maintenance, not just the contract price. A practical comparison tracks monthly cost per active viewer and per successfully answered business question under representative workloads.
What is the best way to run a fair Databricks vs Looker pilot?
Use the same business decision, dataset, metric definitions, access roles, and representative questions in both products. Run the pilot long enough to capture real usage, ideally 30 days, and compare correctness, unauthorized access attempts, load times, compute cost, adoption, and model-maintenance effort.
Related Articles
Anomalo vs Ataccama vs Soda: Data Quality Compared
Compare Anomalo, Ataccama, and Soda on anomaly detection, governance, integrations, pricing, deployment, and data quality testing.
12 Best Data Catalog Software Tools for 2026
Compare the 12 best data catalog tools for 2026, including AI features, governance, lineage, pricing, deployment, and ideal use cases.